Segmentation and clustering
Although the presence of clusters and average cluster sizes can be deduced directly from point distance distributions (see Pairwise distances), some form of segmentation is needed when quantifying the properties of individual clusters. PYMEVis offers a number of options here.
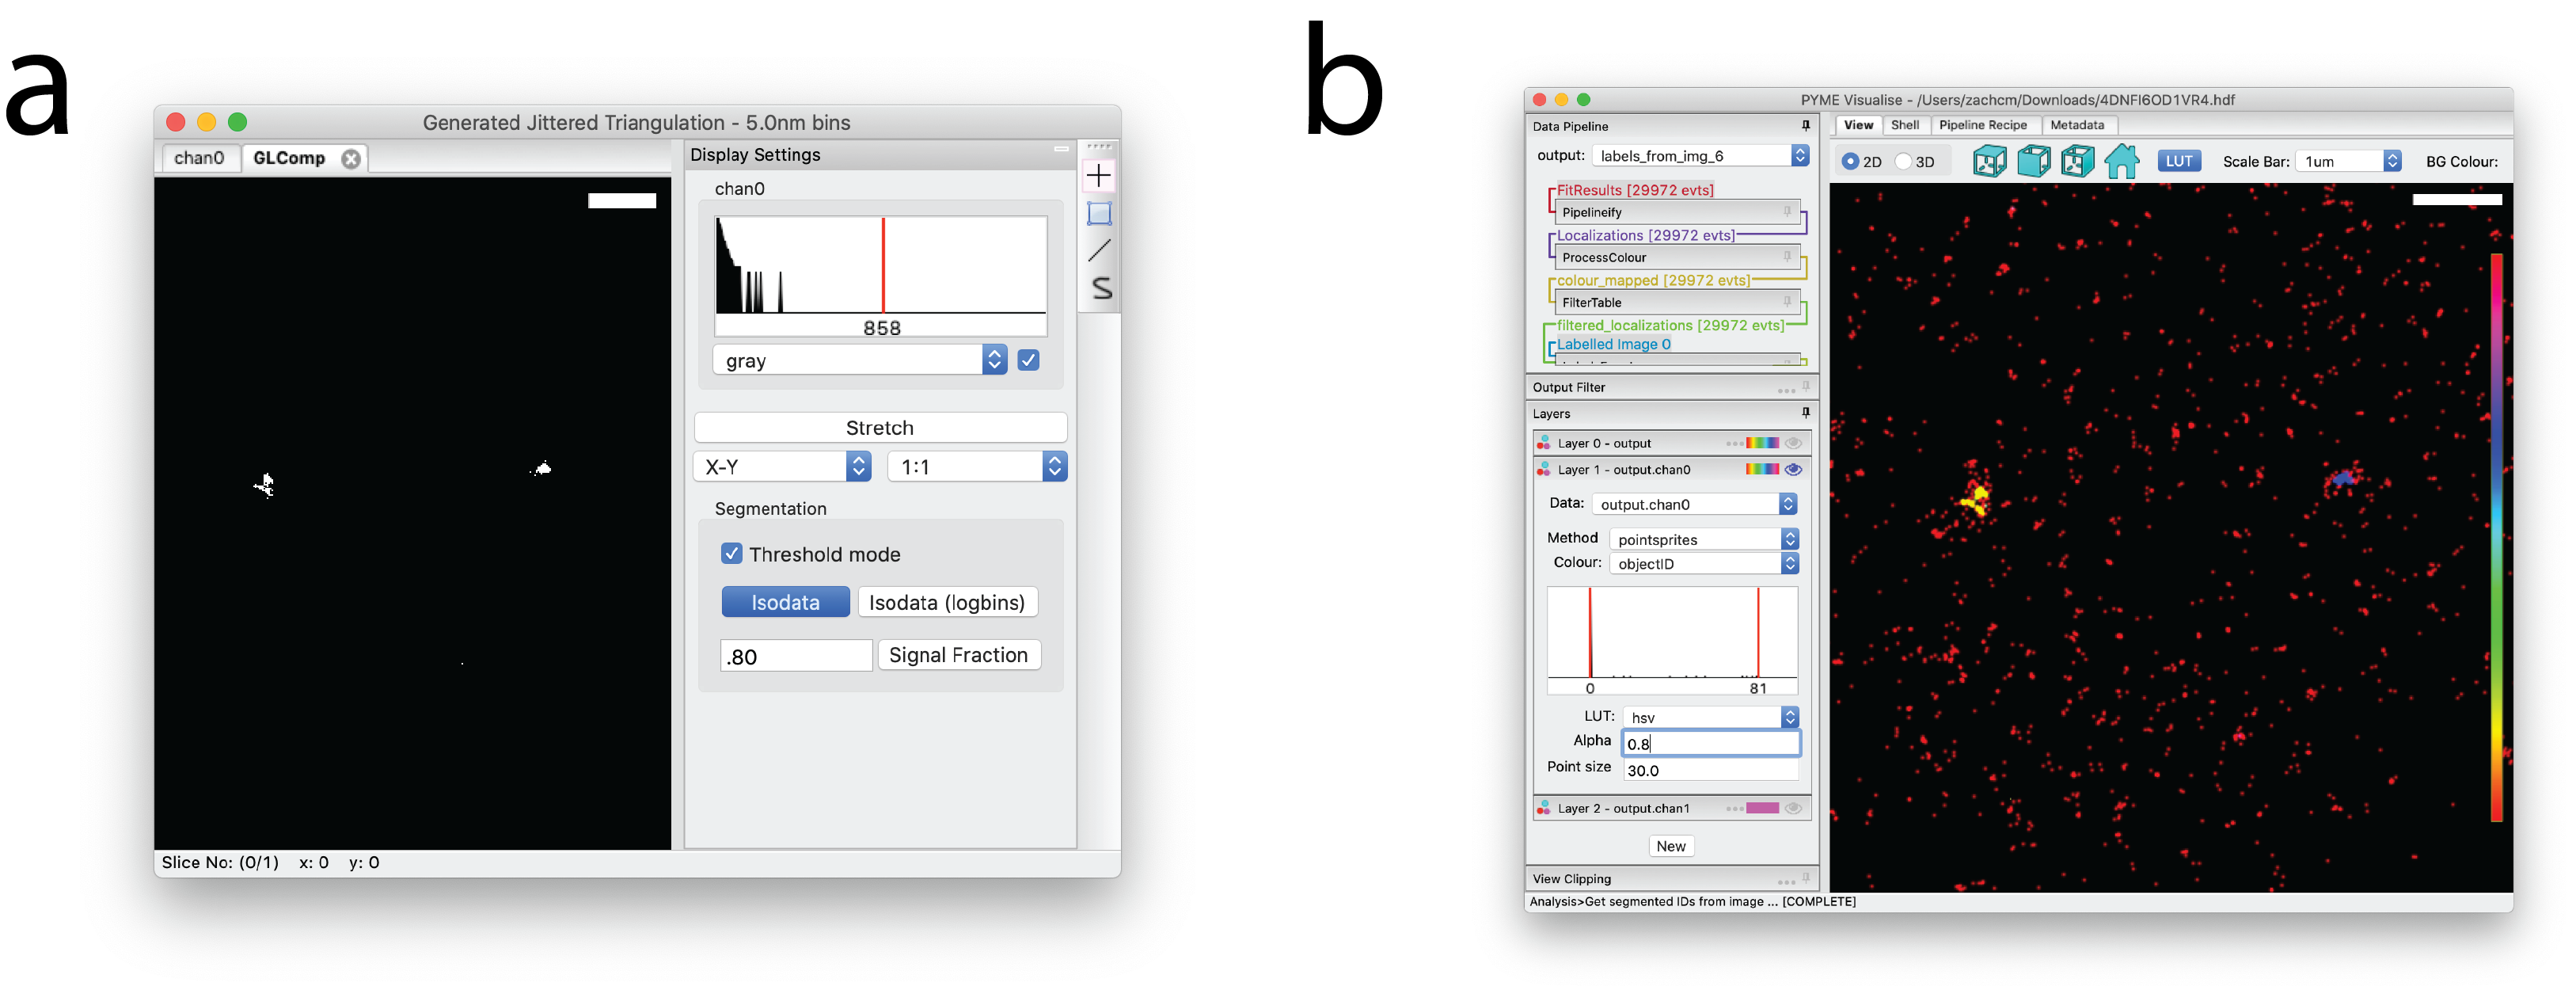
Voxel-based
PYMEVisualise’s Image Reconstruction provides several density image representations that can be thresholded for density-based segmentation. One of the main advantages to this approach is that there is a very large body of existing work in the literature on how to set reasonable thresholds for voxel-based images (e.g. isodata, Otsu) and their limitations are well-characterized. In our experience image based cluster segmentation, when combined with an appropriate density reconstruction algorithm, performs as well as or better than more direct methods such as DBSCAN. It is also by far the simplest way to segment multi-channel data. Once thresholded, the segmentation assignments from the images can be propagated back to the point data.
To threshold a reconstructed image, expand Display Settings, select Threshold mode and press Isodata in the resulting window (Fig. 11 a). For smoother blobs, it can help to run prior to entering threshold mode.
Once the voxel-based image is thresholded, select and enter the minimum
number of pixels a blob must contain to qualify as a cluster in the dialog window that pops up.
A new window named Labeled Image will appear in which each connected region is assigned a unique integer “label”.
Return to the main PYMEVisualise window and select
and choose the labeled image. Recolour by objectID to see the segmented points (Fig. 11 b).
The labeled LUT works quite well for displaying clusters.
Tessellation-based
An attractive method of density reconstruction which gives high-quality segmentations is to use a tessellation of the point data ([baddeley2010], [levet2015]). Although one can segment such tessellations directly, our preferred option is to generate a voxel-based density image from the tessellation and then segment this image (see sec_voxel_based). This is mathematically equivalent, but a little more flexible than the direct method - particularly when it comes to the choice of thresholding algorithm and application to multi-channel data. In PYMEVis this is performed by running , or , and then proceeding as described above.
DBSCAN
If a user prefers to cluster directly on points, an implementation of DBSCAN clustering ([ester1996], [nicovich2017]) is available by selecting from the menu. To see the segmentation, recolour by dbscanClumpID.
Note
DBSCAN relies on single linkages/edge length between points, which makes the algorithm sensitive to noise. It tends to perform less well than the voxel-based segmentation when there is high background.
Exporting object measurements
It is possible to export object measurements to HDF or CSV file, which can then be further analyzed in a Jupyter notebook, Excel, etc. To do this, navigate to . A tabular viewing window will appear, as shown in Fig. 12. Click on the disk drive icon in the upper left of the window to save the results to file.

Fig. 12 Tabular viewing window.
- nicovich2017
Nicovich, D. M. Owen, and K. Gaus, “Turning single-molecule localization microscopy into a quantitative bioanalytical tool,” Nat. Protoc., vol. 12, no. 3, pp. 453–461, 2017.
- ester1996
Ester, H.-P. Kriegel, J. Sander, and X. Xu, “A density-based algorithm for discovering clusters in large spatial databases with noise,” Proceedings Second Int. Conf. Knowl. Discov. Data Min., pp. 226–231, 1996.
- baddeley2010
Baddeley, M. B. Cannell, and C. Soeller, “Visualization of localization microscopy data,” Microsc. Microanal., vol. 16, no. 1, pp. 64–72, 2010.
- levet2015
Levet et al., “SR-Tesseler: A method to segment and quantify localization-based super-resolution microscopy data,” Nat. Methods, vol. 12, no. 11, pp. 1065–1071, 2015.